


Method of displaying an analytical report for the most or least sold and profitable products
Viewing the Product Sale Profit Report
Through the "Product Sales Profit - By Product" report, you can view the details of sales transactions and their returns for each product, along with displaying the average cost of each product and the profitability resulting from the sales operations.
You can view the “Item Sales” report by following these steps:
- From the main menu, click on “Reports”.
- Through the Reports menu, click on “Sales Reports”.
- Select to view the report “Product Sales Profit – Product”.
- You can also choose to display the report by client, staff, or sales person.
- After displaying the report, set the search parameters and filter as follows:
- Date Range: Specify the period for which the report is to be displayed.
- Last Month: Sales transactions for products during the last month will be displayed.
- Last Year: Sales transactions for products during the last year will be displayed.
- Custom: Through this, you can specify the start and end of the period for which the report is to be displayed.
- Category: Choose the category for which you want to display only the transactions of its products.
- Brand: Specify the brand for which you want to display only the transaction of its designated products.
- Branch: Specify the branch for which you want to display only the transactions of products added through it.
- Date Range: Specify the period for which the report is to be displayed.
- Click on “Search”.
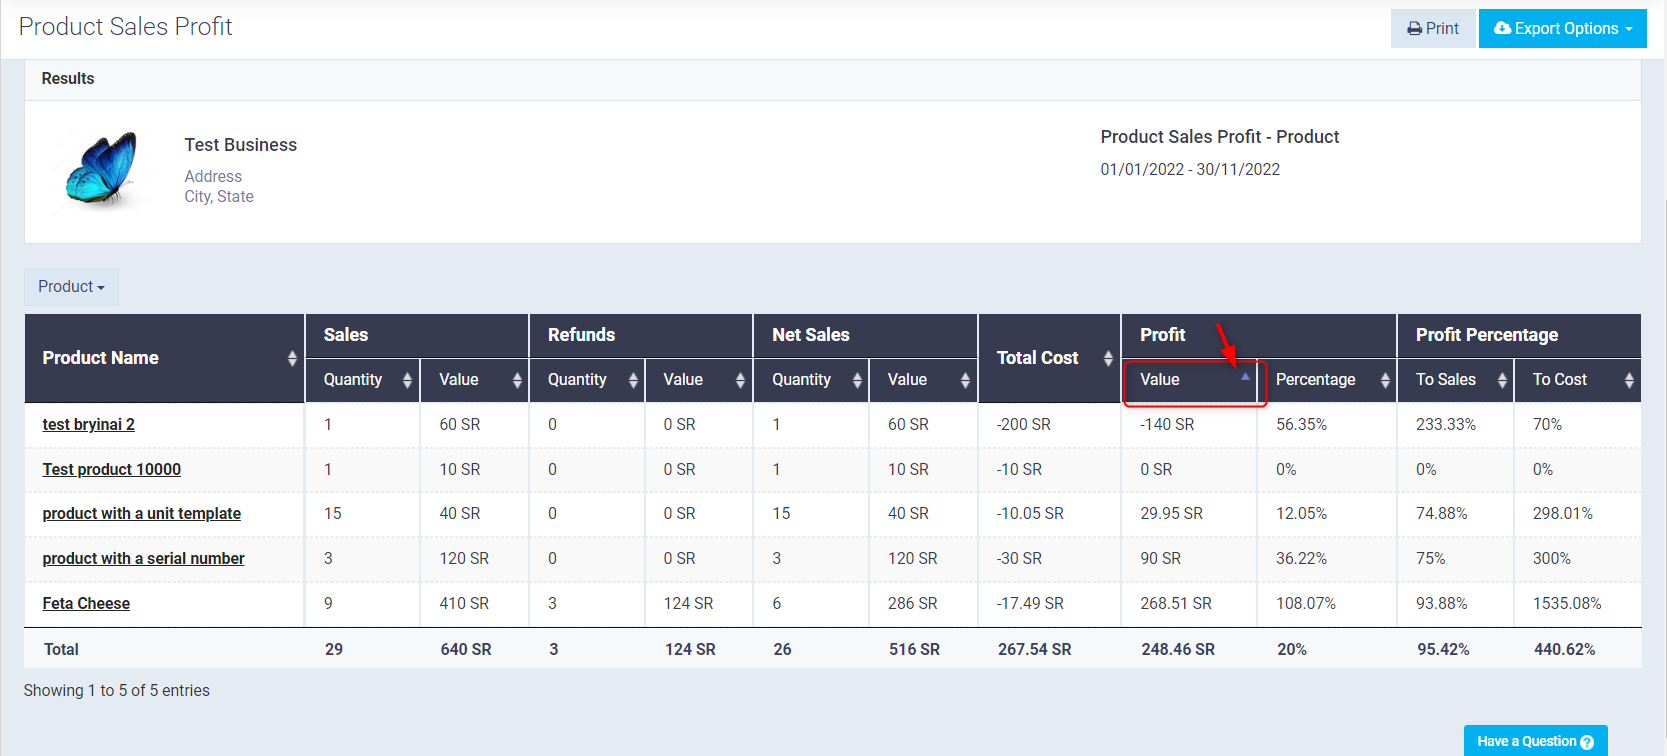
Displaying the Data of the Most or Least Sold and Profitable Products
Through the report, you can control the way of displaying and arranging product data, where you can specify the order of data for each column to display the quantities/values of the products according to the highest to lowest quantities or values.
Example:
After displaying the report, apply the following:
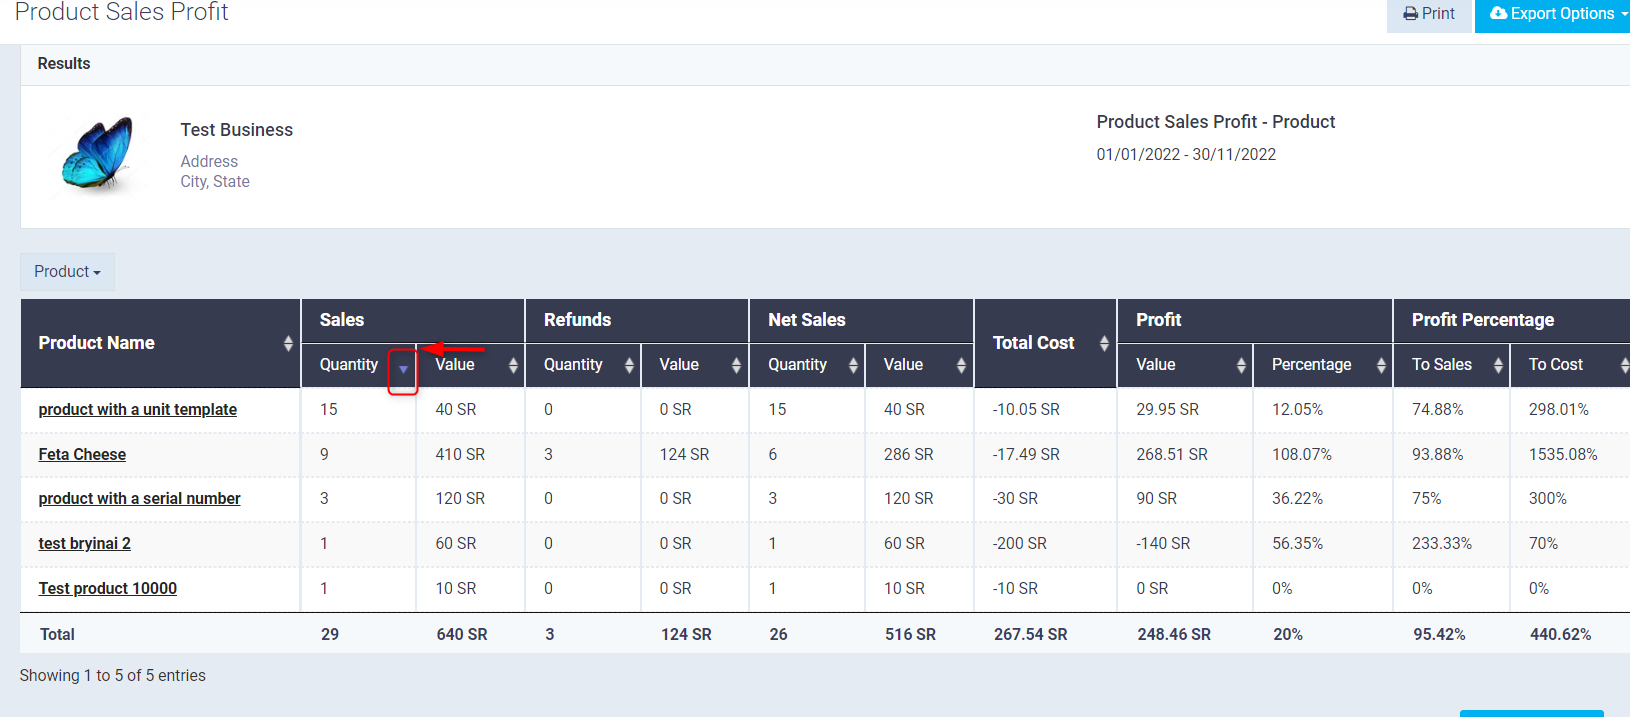
1. Click on the arrow icon next to any column in the report data table.
2. Based on the applied setting, the data will be displayed in descending order from the highest to the lowest quantities, down to the product with the least quantity sold.
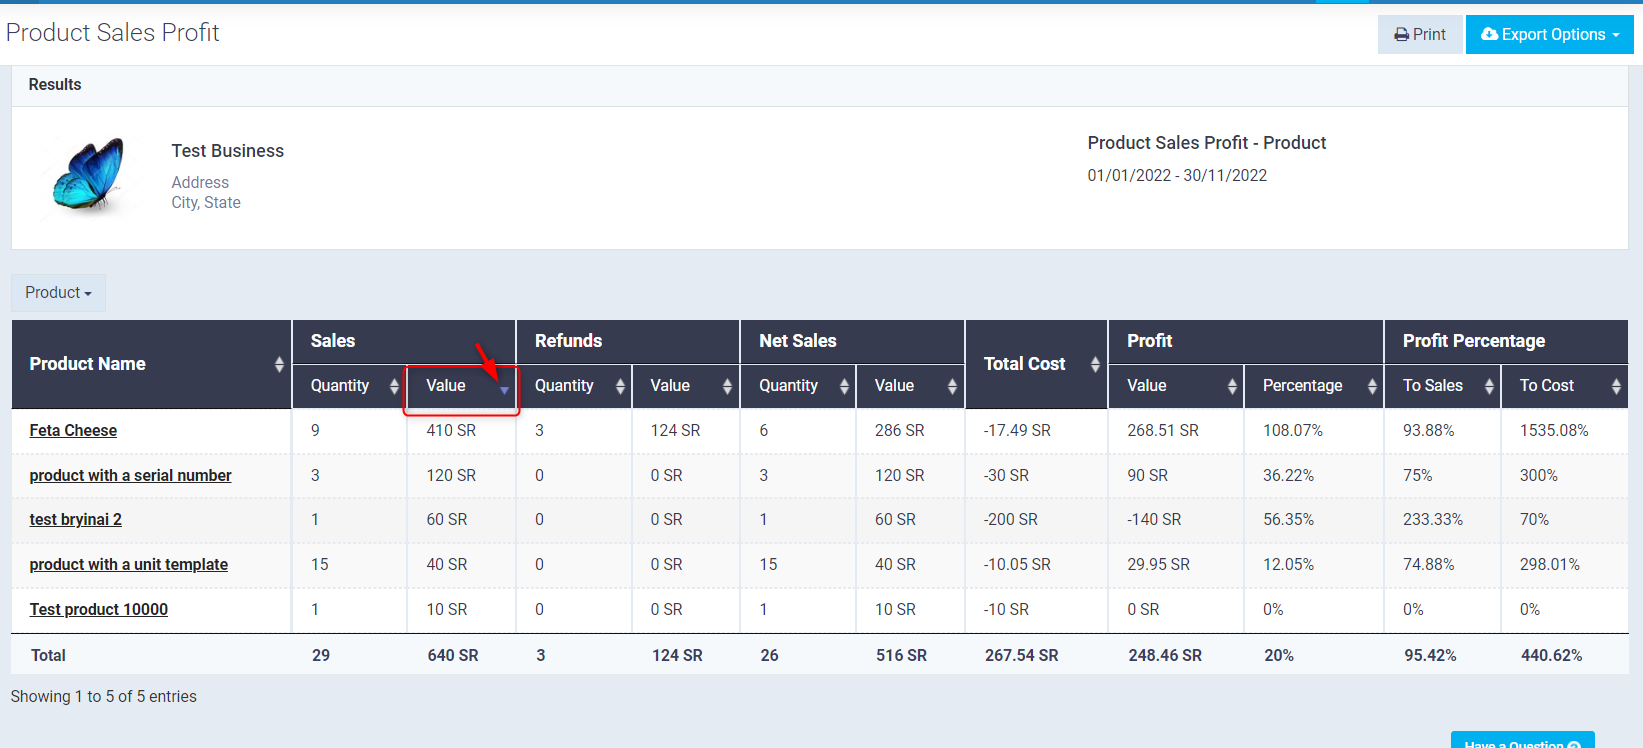
3. If the data is arranged in descending order through the value field, the products will be displayed in descending order from the highest to the lowest values.
Note: If the order is applied through the quantity field, the values will be arranged from the largest to the smallest, but it will be noticed that the quantities will not be arranged in descending order as well since they are associated with their corresponding values and will be displayed according to the quantity sold of the value shown in the second field.
4. You can apply the same idea of arranging data from highest to lowest or vice versa through the profit or cost field as shown in the following image.